
Exploring the Power of Embedded Charts: Elevating Salesforce Reports & Dashboards
In the intricate realm of business operations, harnessing the potential hidden within data is the cornerstone of informed decision-making. Here, the power of Salesforce Reports and Dashboards comes to the forefront, offering a sophisticated approach to navigating the complexities of data. Today, we’ll shine a light on how to understand how the integration of dynamic charts as tools can aid in your decision-making
Empowering Swift Decisions with Real-Time Insights
Data visualization is more than displaying numbers; it’s about comprehending trends, spotting patterns, and uncovering opportunities. Salesforce Reports provide a lens to immediate insights, granting you a live glimpse into your sales pipeline, customer interactions, and performance metrics. Armed with customized reports, you aren’t merely informed; you’re equipped with the agility to orchestrate success.
Crafting Visual Narratives through Dashboards
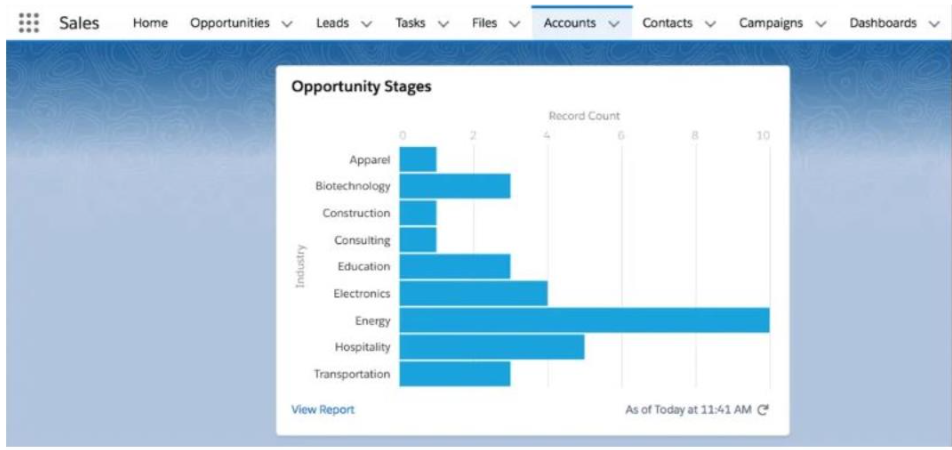
Salesforce Dashboards take this narrative further, seamlessly translating intricate data into engaging visuals. Dynamic displays present key performance indicators, sales trajectories, and customer behaviors in a captivating manner. The incorporation of interactive charts and graphs transforms these numbers from passive data points to tailored information.
A Paradigm Shift: Embedded Insights for Maximum Impact
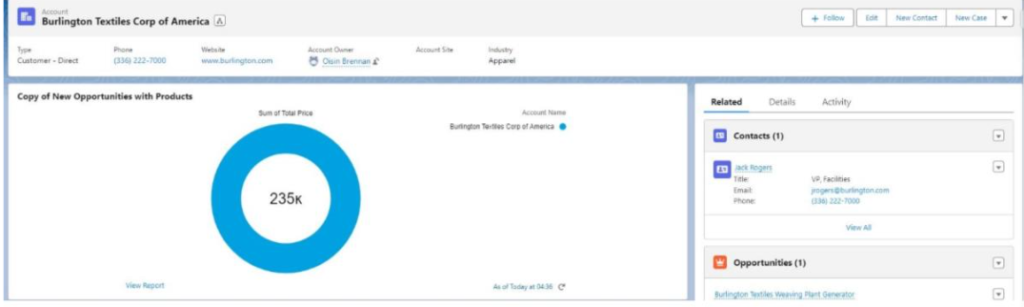
Imagine a scenario where these dynamic charts seamlessly inhabit specific pages crucial to your ways of working. Whether reviewing an account before orchestrating a crucial sales meeting or supervising a project management dashboard, the integration of embedded insights becomes a game-changer. Immediate access to critical data eliminates the need for toggling between tabs, bolstering collaboration and operational efficiency.
Fostering Unified Understanding for Informed Action
Embedded charts foster a shared understanding across departments and hierarchical tiers. From executive stakeholders to frontline teams, a common comprehension of data nuances takes shape. Collaboration becomes intuitive, decision-making gains speed, and the organization advances cohesively.
The essence of Salesforce Reports and Dashboards transcends visual representation; it’s about transforming data into actionable insights. With embedded charts, this essence reaches its pinnacle. Your decisions become powered by real-time insights seamlessly woven into your daily work.
Thanks for reading,
Oisin Brennan
The Tether Team