
Page Analyser
The Final piece of our three-part series is the Salesforce Page Analyzer, this feature is accessible from the Lightning App Builder in Salesforce and allows you to ensure the functionality and performance are balanced hand in hand.
To start using the Page Analyzer navigate to the Lighting App Builder. Select the desired page you wish to review, and the Page Analyser component will automatically load in the bottom right-hand corner of your screen like so.
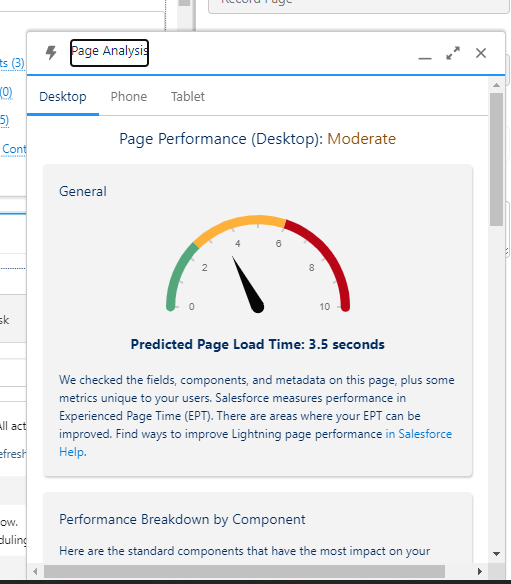
Once the component has loaded you will see a metric chart displaying you predicted load times, and you can quick see the load times for desktop, phone and table by selecting one of the tabs above the chart.
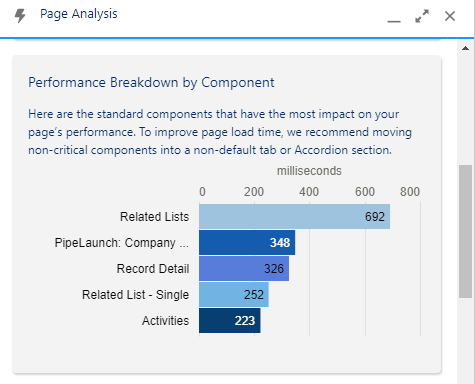
As you scroll down you will then see a further breakdown by components of the predicted load times in milliseconds.
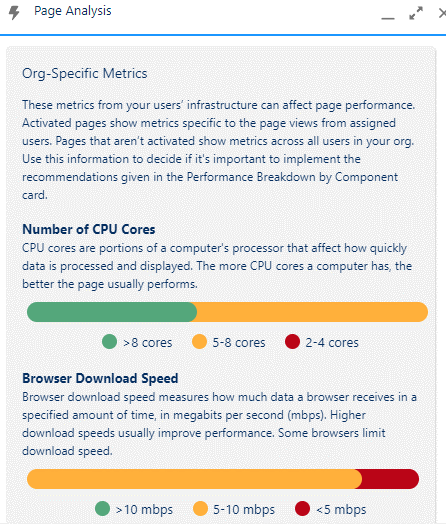
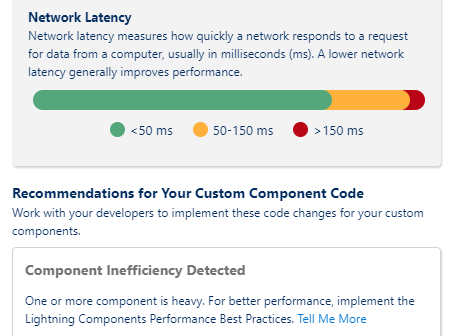
While also casting an eye over your Org Specific metrics for number of CPU cores currently used, Browser Download Speeds and Network Latency.
The Final Section of this component, flags potential component issues and also provides help articles where possible on how to improve the efficiency of your components.
Hope you found this trilogy helpful.
Thanks for reading!
Mark Hanaway
The Tether Team
#salesforce #salesforcecrm #tethertips #tether #getchecked #org